How to Debug
From PartKeepr Wiki
How to debug using Firefox
- Install FireBug
- Open FireBug
In case any error appears, please report it. As Firebug also can make the requests visible, you can also post these.
How to debug using Google Chrome / Chromium
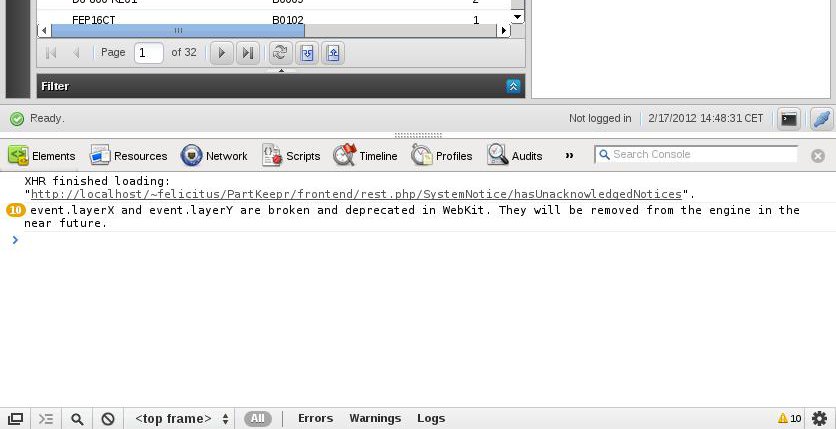
Google Chrome / Chromium comes with built-in developer tools. You can access them using F12 on most machines or by the wrench, then Tools>Developer Tools.
Prior debugging, right-click on the main area when "console" is active, then click "Log XmlHttpRequests".
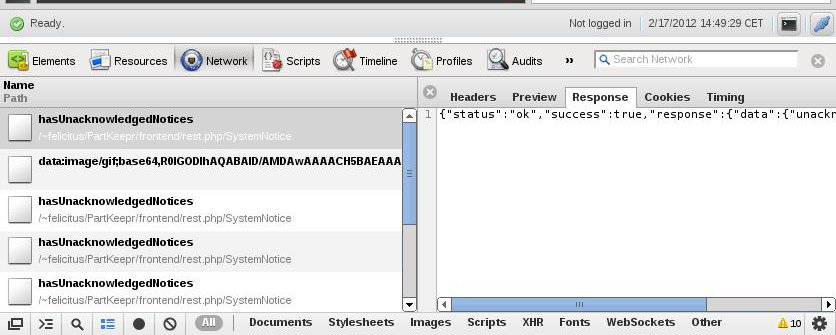
If an error appears, post that error. If the error is likely to be caused by an XmlHttpRequest, you can view the request and post details about it also.
To inspect an individual request:

