Difference between revisions of "How to Debug"
From PartKeepr Wiki
m (moved Howto Debug to How to Debug) |
(Detailed instructions for Chromium) |
||
| Line 13: | Line 13: | ||
If an error appears, post that error. If the error is likely to be caused by an XmlHttpRequest, you can view the request and post details about it also. | If an error appears, post that error. If the error is likely to be caused by an XmlHttpRequest, you can view the request and post details about it also. | ||
| + | |||
| + | To inspect an individual request: | ||
| + | |||
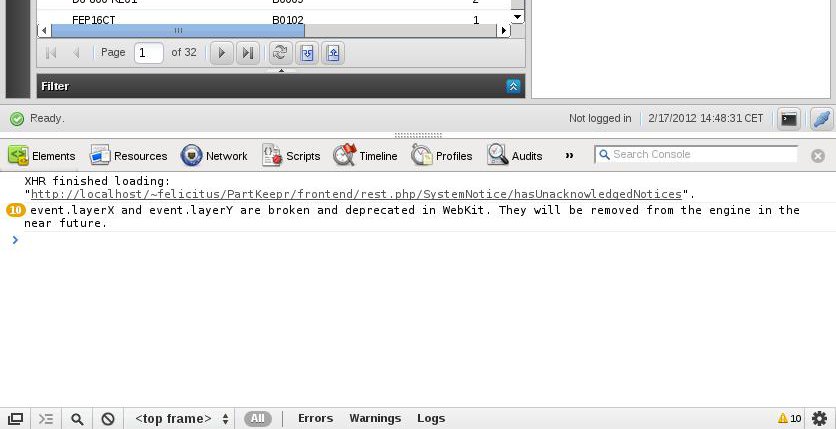
| + | [[Image:Howto debug chromium 1.jpg|200px|frame|none|Click the request you wish to inspect (Note that on older Chromium Versions than 16, this was buggy - you need to navigate to the "Network" tab and find your request there manually).]] | ||
| + | |||
| + | |||
| + | |||
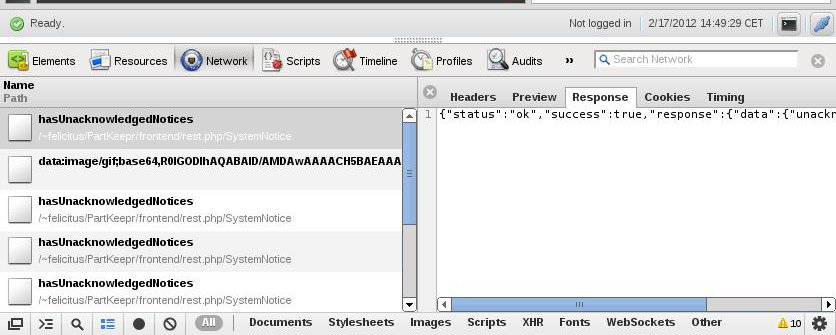
| + | [[Image:Howto debug chromium 2.jpg|200px|frame|none|Now you can click the request (you might want to filter for "XHR"), and you can inspect the headers which have been sent as well as the response as it came from the server.]] | ||
Revision as of 15:57, 17 February 2012
How to debug using Firefox
- Install FireBug
- Open FireBug
In case any error appears, please report it. As Firebug also can make the requests visible, you can also post these.
How to debug using Google Chrome / Chromium
Google Chrome / Chromium comes with built-in developer tools. You can access them using F12 on most machines or by the wrench, then Tools>Developer Tools.
Prior debugging, right-click on the main area when "console" is active, then click "Log XmlHttpRequests".
If an error appears, post that error. If the error is likely to be caused by an XmlHttpRequest, you can view the request and post details about it also.
To inspect an individual request:

